Random Graphs
The ”Erdos- Renyi Model” describes two similar models for generating random graphs.
1. G(n,M)Model: This model takes two parameternandM.ndenotes the order of the graph andMdenotesthe size of the graph. The model will randomly choose one graph from the all the possiblegraphs that satisfy these two parameters.
2. G(n,p)Model: This model takes two parameters. Here,nis still the order of the graph, butprepresentsthe probability any edge is connected.
Graph Heat Equation
Both the even and odd laplacians can be used to solve the graph heat equation.
Get the code to create your own heatmaps on different networks.
Code for solving graph heat equation
Code for average temperature
Simulating the SIR on a grid
Different starting positions and sizes yield different spreads through the grid-like network.
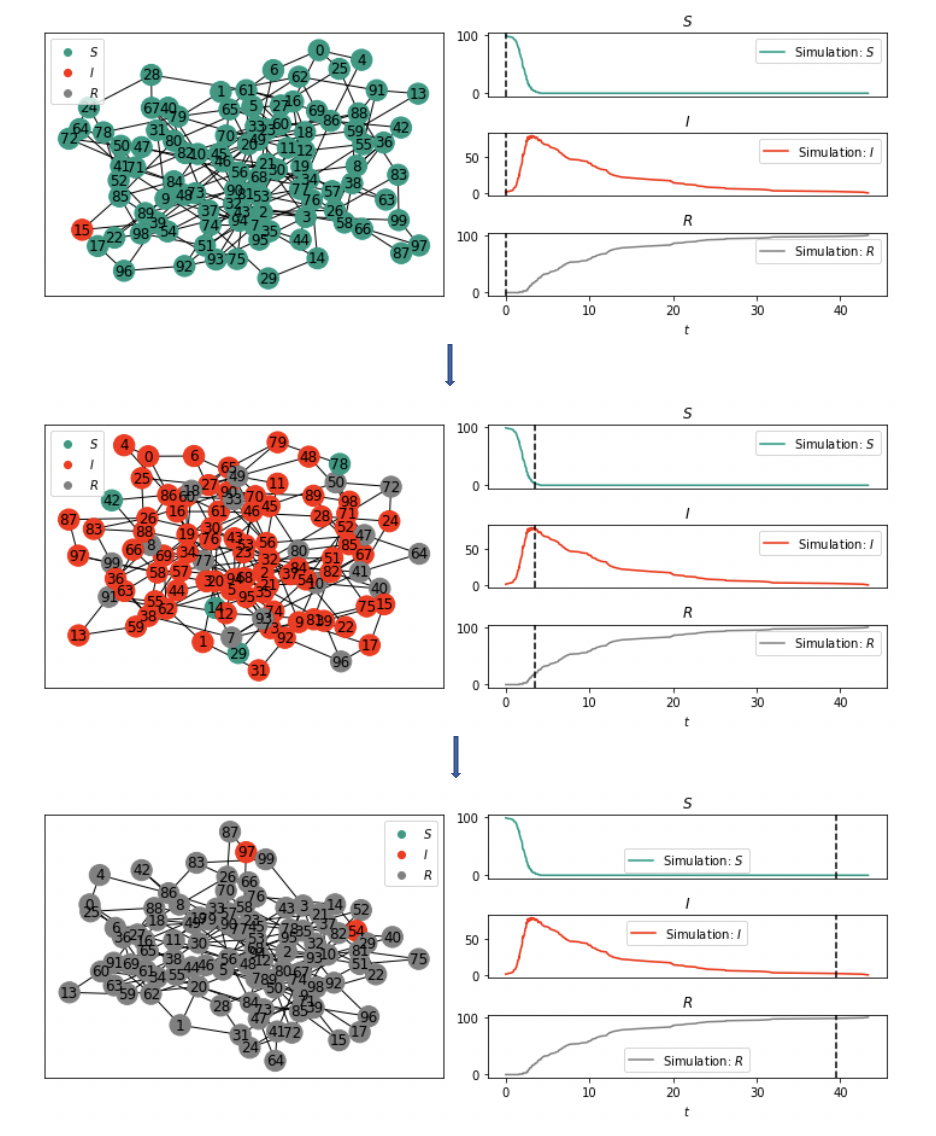
Stochastic simulation of SIR on a SWN

The stochastic spread of disease in a SWN using SIR model

Hierarchy tree representing the spread of disease through nodes
Simulate different disease models on different graphs to see the spread and the hierarchy tree.
Zombie Apocalypse
As time progresses, the green nodes (susceptible) are infected by the red nodes (zombie). Over time, susceptibles also die from natural causes and turn into blue nodes.