The smallworldness of a network can be determined by a small coefficient, sigma. To calculate this, the clustering coefficient and characteristic path length are compared to an equivalent random network of the same average degree. However, this indice performance suffers when the network is large. Thus, the omega indice is a better quantifier of smallworldness. To learn more, click here.
THE BIG QUESTIONS
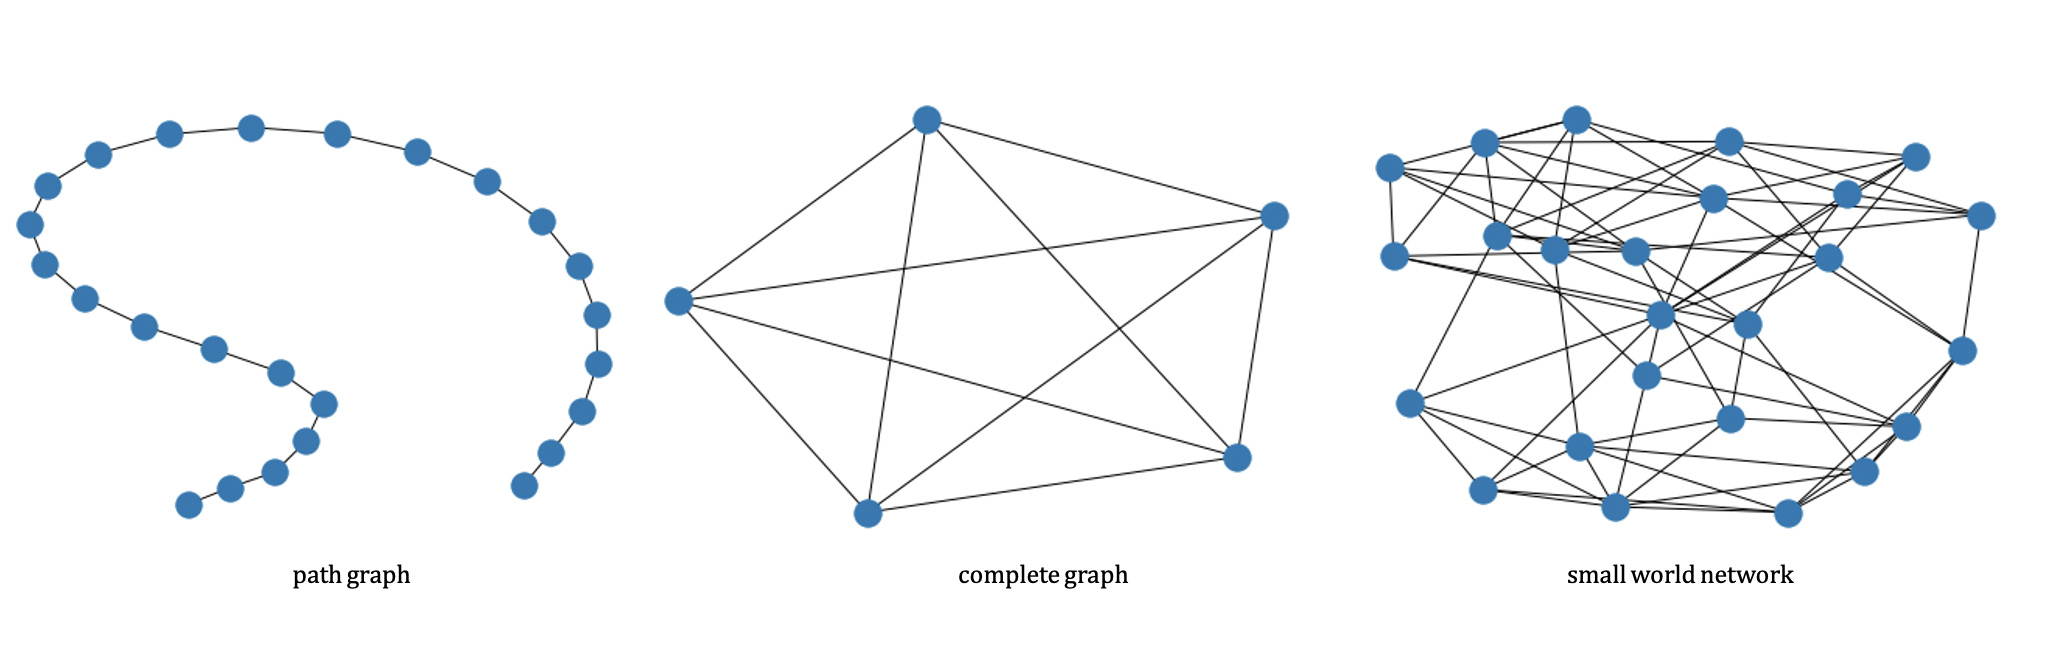
- What makes a Small World Network (SWN)?
- What is the sigma and omega indice?
- How do the even and odd Laplacian compare to each other?
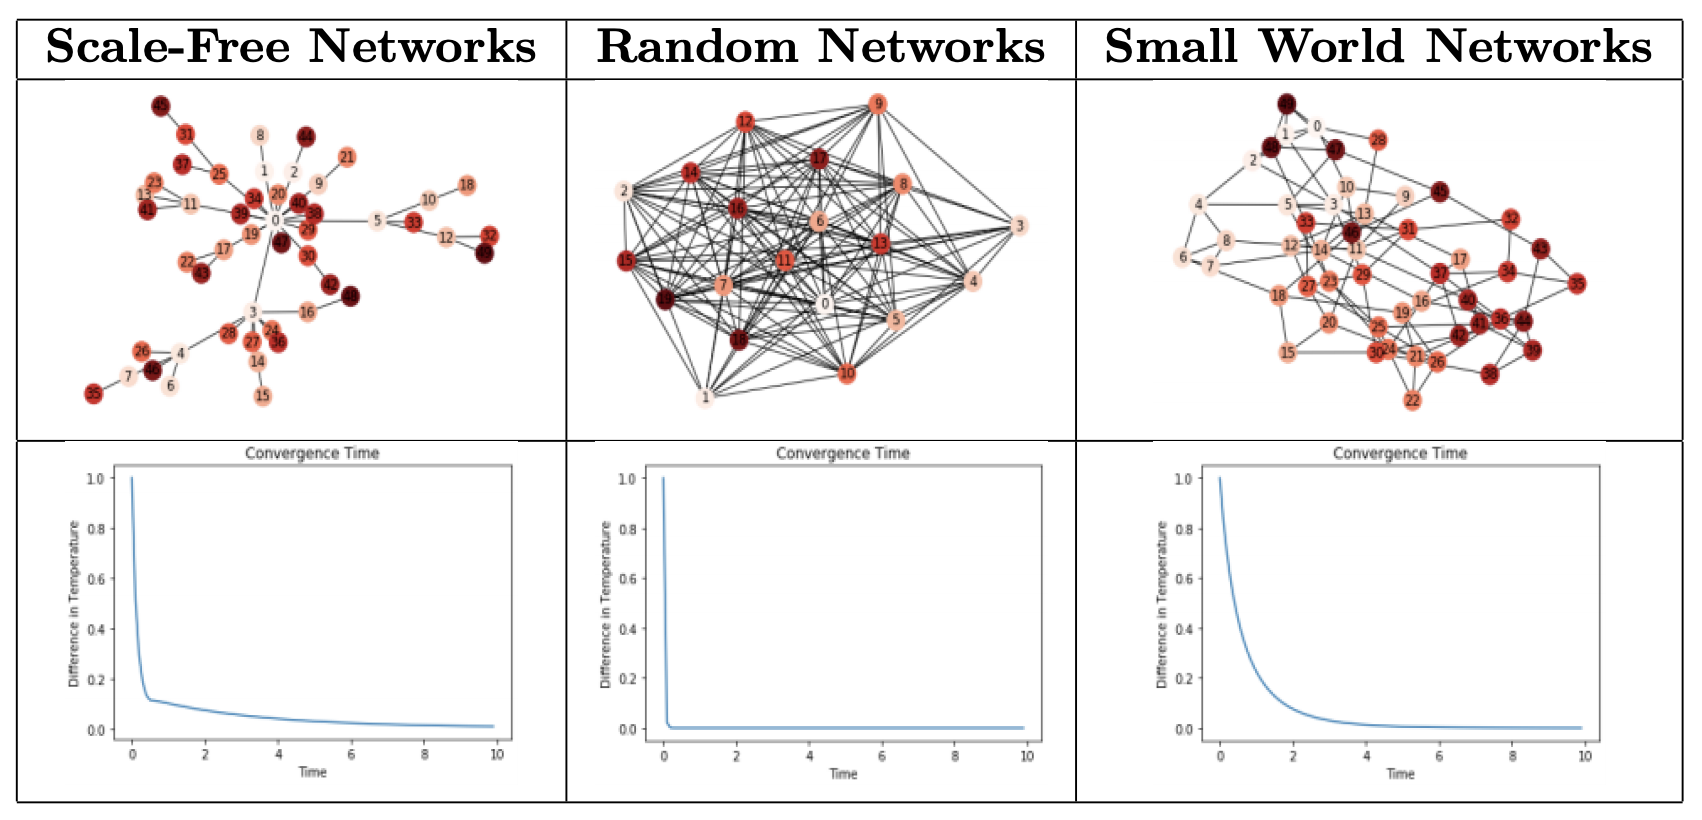
- How do we visualize the diffusion of heat on SWN?
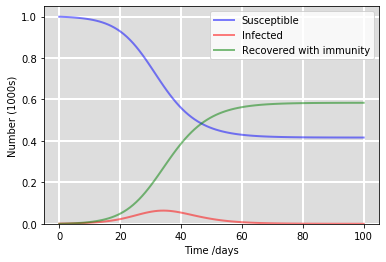
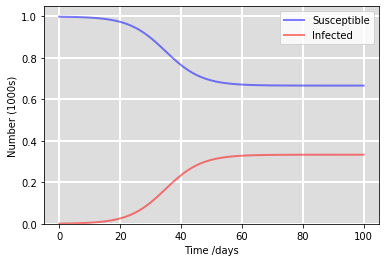
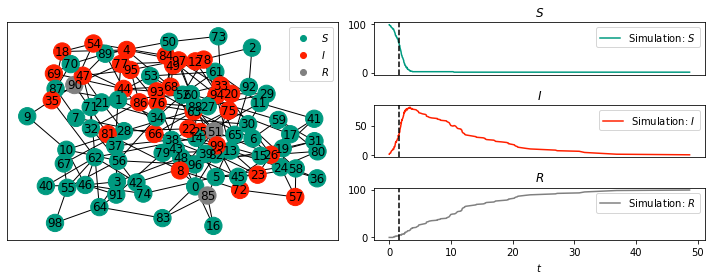
- How do epidemics spread through different networks?
- How would a Zombie Apocalypse look like in a SWN?